PURE BUILDERS ELASTIC: Beat and ingest pipeline
In this fourth post in this series, I’ll describe how to use an Ingest Node Pipeline to process our incoming documents. We will use the ingest pipeline to split the JSON log data we’ve created in our Python application, so that we can use the individual fields in Elastic for further processing.
As a quick reminder, the purpose of this blog series is to write about the steps I took in my journey to build a teeny tiny data pipeline using Python, Kubernetes and ElasticSearch.
The idea of the data pipeline I’m creating, is to use Python to export data from the FlashArray and FlashBlade to a log file and then ingest this data into ElasticSearch. In my example, I’ll be collecting volume statistics, such as size, used space and the data reduction numbers per volume.
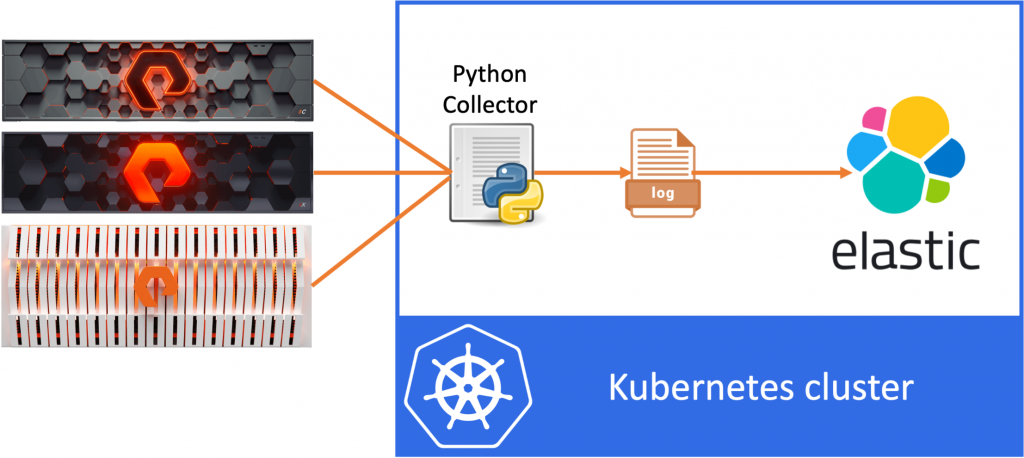
In the first blog we’ve created the Python application, in the second blog we’ve containerized the app. Then in the last blog we’ve deployed ElasticSearch, Kibana and Beats. And we are now bringing this all together in this post.
Kibana
In our last post we ended our work by having filebeat shipping logfiles to our ElasticSearch cluster. This way all logs from all containers on my Kubernetes cluster is shipped to our ElasticSearch cluster. To continue from there, let’s go ahead and login to our Kibana interface (which we covered in the previous post).
If we navigate to Kibana -> Discover, sure enough I can see the filebeat data coming in.

However if I look in one of the log entries for my python app, the JSON output that we’ve logged from Python shows as a single line in the “message” field:

All the information is there, however since the entire entry is stored in a single filed we cannot use it as it is. We need to split our message field into separate fields, so that we can use those fields to build a nice dashboard in Kibana.
Ingest Node Pipelines
Now there are multiple ways to solve this issue, the way I’ll show below is by using an Ingest Node Pipeline on Elastic to split the fields. However there are other options too, which I’ll mention at the end of this post.
What we are going to do in this blog is the following:
- Create an ingest pipeline on ElasticSeach to split the “message” field into separate fields
- Change our filebeat configuration to use the new ingest pipeline and also add some Kubernetes info to our log information
The first step here is to create our Ingest Node Pipeline. The ingest pipeline allows us to add data processors for incoming documents. This allows us to split the “message” field (which contains JSON data) into multiple separate data fields that Elastic understands.
Create our Ingest Node Pipeline
Login to Kibana and navigate to Stack Management -> Ingest Node Pipelines. Here the current ingest pipelines are listed. Now click on the Create a pipeline button to create a new ingest pipeline.
We can now enter the name and description for the new pipeline. I’ve used “pure-builder” as the name.
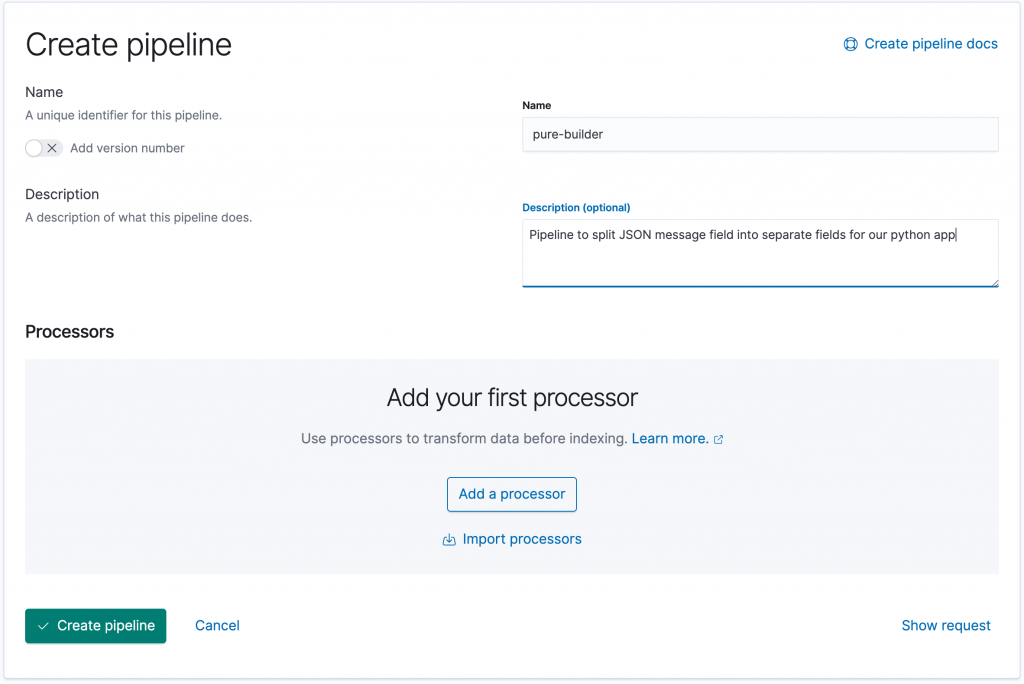
The next step is to add a processor by clicking the Add a processor button.
For the processor, we’ll choose the JSON processor, which creates a JSON object from a compatible string.
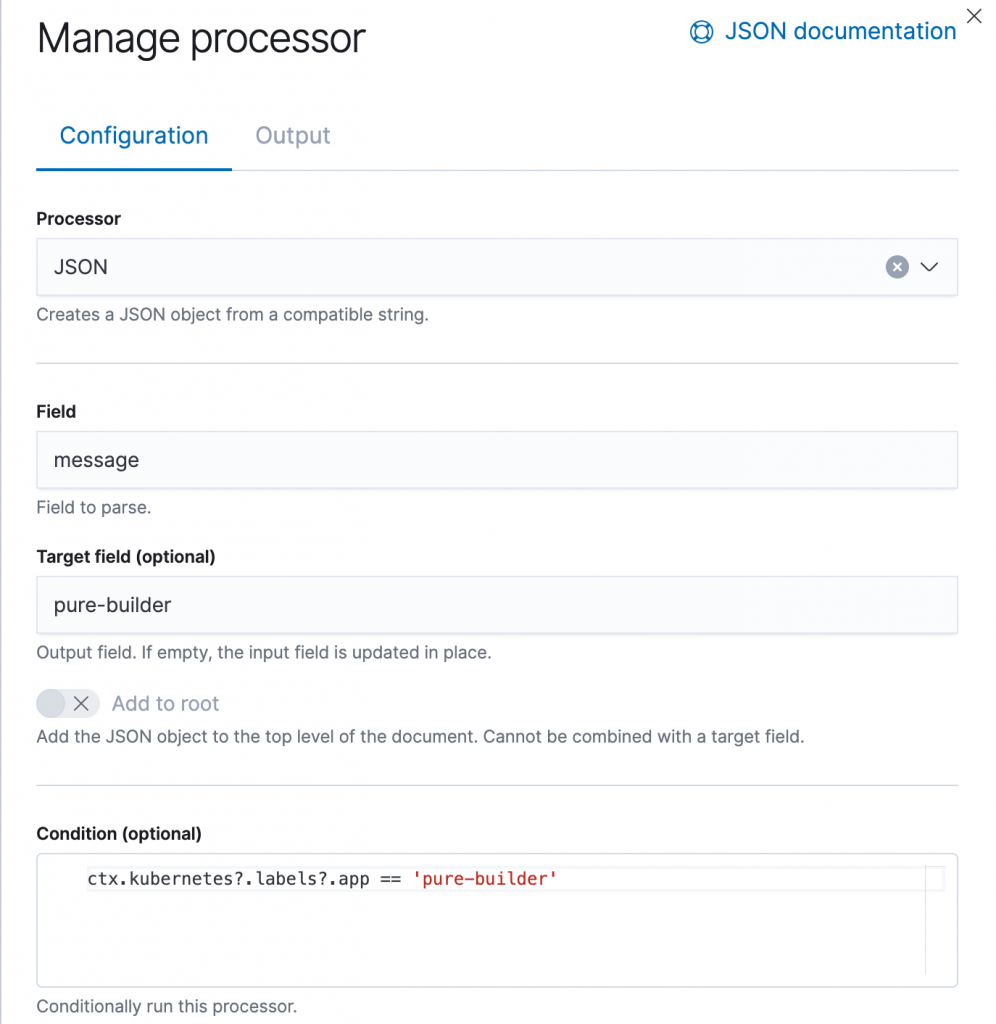
The Field we want to process if our “message” field. The Target field is the name of the field where our JSON object is stored, for this we’ll use “pure-builder” (I know, I don’t have a lot of imagination for names).
This effectively means that a JSON string in the “message” field is processed by the JSON processor and the resulting fields are stored under the “pure-builder” field.
However we do not want to process all incoming messages from filebeat, as there can also be other containers on this environment, where the message field is not a JSON field. For this we add a Condition to our processor:
ctx.kubernetes?.labels?.app == 'pure-builder'
This condition checks if the Kubernetes label “app” is set to “pure-builder” for this message. So now, we are only processing messages (or log entries) from our actual Python application.
Once messages enter our ingest pipeline and match the condition, we will try to split the “message” field into the “pure-builder” field.
Back to filebeat…
Although we’ve created an ingest node pipeline, we still need to make sure that filebeat start using this pipeline for all documents that it uploads to Elastic.
We will continue from the filebeat deployment that we used in the previous post. However if you had taken a close look at the messages shipped to Elastic, there was not Kubernetes context data, so the Condition we specified in our ingest pipeline would never match. So we actually have to make two changes to our filebeat configuration:
- We need to add the Kubernetes context data (eg. de labels for our pods)
- Point filebeat to our new ingest pipeline, so that it is applied to our documents
For that we will make the following changes to our filebeat.yaml configuration file.
apiVersion: beat.k8s.elastic.co/v1beta1
kind: Beat
metadata:
  name: quickstart
spec:
  type: filebeat
  version: 7.10.0
  elasticsearchRef:
    name: quickstart
  kibanaRef:
    name: quickstart
  config:
    filebeat:
      autodiscover:
        providers:
        - type: kubernetes
          node: ${NODE_NAME}
          hints:
            enabled: true
            default_config:
              type: container
              paths:
              - /var/log/containers/*${data.kubernetes.container.id}.log
    processors:
      - add_host_metadata: {}
    output.elasticsearch:
      pipeline: pure-builder
  daemonSet:
    podTemplate:
      spec:
        serviceAccountName: filebeat
        automountServiceAccountToken: true
        terminationGracePeriodSeconds: 30
        dnsPolicy: ClusterFirstWithHostNet
        hostNetwork: true
        containers:
        - name: filebeat
          securityContext:
            runAsUser: 0
          volumeMounts:
          - name: varlogcontainers
            mountPath: /var/log/containers
          - name: varlogpods
            mountPath: /var/log/pods
          - name: varlibdockercontainers
            mountPath: /var/lib/docker/containers
          env:
            - name: NODE_NAME
              valueFrom:
                fieldRef:
                  fieldPath: spec.nodeName
        volumes:
        - name: varlogcontainers
          hostPath:
            path: /var/log/containers
        - name: varlogpods
          hostPath:
            path: /var/log/pods
        - name: varlibdockercontainers
          hostPath:
            path: /var/lib/docker/containers
---
apiVersion: rbac.authorization.k8s.io/v1
kind: ClusterRole
metadata:
  name: filebeat
rules:
- apiGroups: [""] # "" indicates the core API group
  resources:
  - namespaces
  - pods
  verbs:
  - get
  - watch
  - list
---
apiVersion: v1
kind: ServiceAccount
metadata:
  name: filebeat
  namespace: default
---
apiVersion: rbac.authorization.k8s.io/v1
kind: ClusterRoleBinding
metadata:
  name: filebeat
subjects:
- kind: ServiceAccount
  name: filebeat
  namespace: default
roleRef:
  kind: ClusterRole
  name: filebeat
  apiGroup: rbac.authorization.k8s.io
Quite a few changes, I know. The first thing I’ve changed is to replace the filebeat.inputs: section with autodiscover. This allows filebeat to discover our Kubernetes pods and subsequently parse the logs for each of them. However this change requires quite a few changes to our yaml file.
- We’ve removed the
filebeat.inputs:section and replaced it with thefilebeat:/autodiscover:section. - The new section uses the
NODE_NAMEenvironment variable to filter out the pods running in the current node. - Since we use the
NODE_NAMEin our configuration, we have to pass it to our pod using theNODE_NAMEenvironment variable (env:). This variable will be unique to each filebeat pod in the DaemonSet. - Finally for filebeat to be able to retrieve the Kubernetes information from the cluster, it needs a service account to contact the Kubernetes API. We specified the ServiceAccount as
filebeatand at the end of the file we’ve create the ServiceAccount, ClusterRole and ClusterRoleBinding to actually provide the correct permissions to filebeat.
So now filebeat will retrieve the Kubernetes context information, like labels, pods, containers, etc and add that information to the documents it ships to ElasticSearch. That is a good thing, since this will now allow our condition to check the label of the pod in the message and if it is set to “app=pure-builder” apply our JSON processor.
The second part of the change is simple, we’ve added the following two lines to the filebeat config:
    output.elasticsearch:
      pipeline: pure-builder
These lines tell filebeat to use the ingest pipeline called pure-builder when uploading documents into Elastic. That will cause all messages to pass through our ingest processor and split now the “message” field will get split for every log line generated by our Python application.
So let’s apply the new config using:
kubectl apply -f filebeat.yaml
Which will update our filebeat deployment and restart the filebeat pods one by one. Once the update is finished, we can head back over to Kibana.
Back at Kibana
If we now head over to our Discovery section of Kibana we should see that our messages now not only have the “message” field also the “pure-builder” fields as shown below.
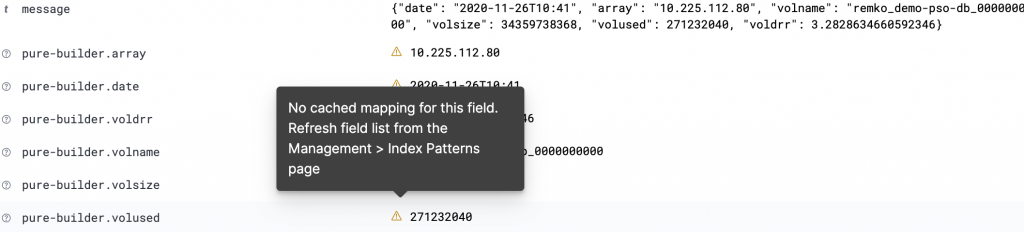
Great, so we now have individual fields that we can use in Kibana for our dashboard! Just a small issue it seems, as there is a warning that there are no cached mappings for our new fields.
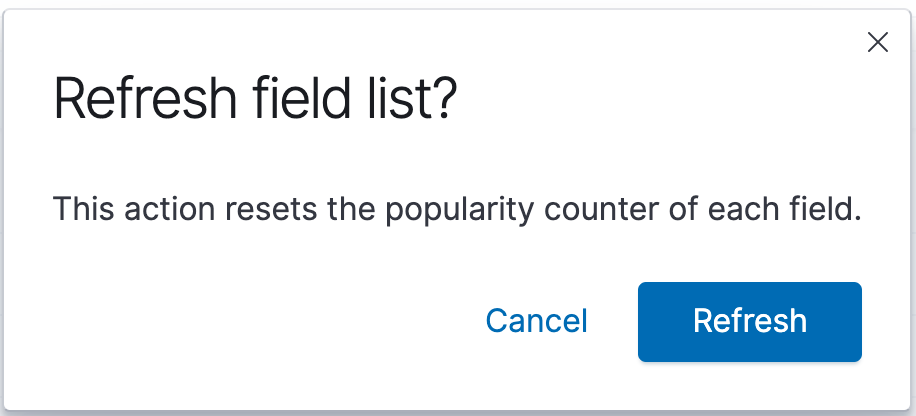
This can be solved easily as suggested by the pop-up mesage. Head over to Stack Management and navigate to Kibana -> Index Patterns, click on the Index Pattern called filebeat-*
Now hit the refresh butten at the top right of the screen and click the Refresh button in the pop-up that appears.
And that is it! We’ve created an ingest pipeline on Elastic to split our JSON data into separate fields, updated filebeat to add Kubernetes context data and use the newly created pipeline and now we are able to start building an amazing dashboard using Kibana.
Alternative to ingest pipeline
In my example I do the data processing at the Elastic level by using an ingest pipeline. However you could also do that at the filebeat level, as Brian Kuebler pointed out to me.
In his example Brian has added a processor to the filebeats configuration, by adding the following lines:
    processors:
      - decode_json_fields:
          fields: ["message"]
          process_array: true
          max_depth: 1
          target: "pure-builder"
          overwrite_keys: false
          add_error_key: true
These lines of code effectively do more or less the same thing as the Elastic Ingest Node Pipeline processor. They take the “message” field, apply the JSON processor and save the result under the target field (in our case “pure-builder”). The only thing I couldn’t find is if you’re able to apply a condition, so that the processor is only applied to our Python application and not all pods. Any comments or suggestions here are welcome!
Conclusion
This post is already way too long, so it’s time to bring it home. In the first two posts of our series we’ve build and containerized our Python app. In the last post, we’ve deployed deployed Elastic, Kibana and used Filebeat to ship our log entries to Elastic. And with this fourth post we’ve finalised the setup by splitting our JSON message into different fields using a data processor as part of the ingest pipeline. We’ve also updated our filebeat config to add Kubernetes data to our entries, which allows us to apply a conditional filter to our ingest pipeline. And with that we have completed our data pipeline and are ready to build our visualisation in Kibana.
Hope you enjoyed the read, and I look forward to seeing you in a next one.