PURE BUILDERS ELASTIC: Elastic Cloud
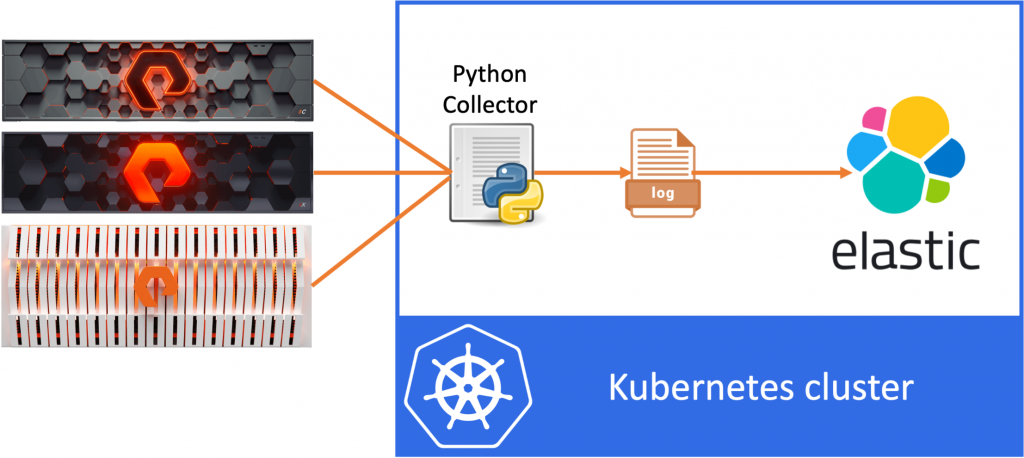
In this third post in this series, I’ll describe how to deploy Elastic Search on Kubernetes using Elastic Cloud. We need this Elastic deployment to be able to ingest the logfiles that are created by the Python application that I’ve created in the first part of this series. As a quick reminder, the purpose of this blog series is to write about the steps I took in my journey to build a teeny tiny data pipeline using Python, Kubernetes and ElasticSearch.
The idea of the data pipeline I’m creating, is to use Python to export data from the FlashArray and FlashBlade to a log file and then ingest this data into ElasticSearch. In my example, I’ll be collecting volume statistics, such as size, used space and the data reduction numbers per volume.
So let’s move on and start deploying our Elastic Search application on Kubernetes!
Elastic Cloud on Kubernetes
There are numerous ways to deploy Elastic search and if you are planning a production deployment, I would encourage you to due you due research on the deployment method that works best for you. The Elastic site provides great resources on architecture, planning, requirements, etc. However for the purpose of this blog, where I just want to get an Elastic Search and Kibana instance up quickly, I’ll be using the Elastic Cloud on Kubernetes deployment.
About Elastic Cloud on Kubernetes
Why did I choose Elastic Cloud on Kubernetes? Well primarily because it’s really simple to deploy. The way it works it that you deploy an Operator on your Kubernetes environment. Once this Operator is up and running, that will take care of deploying, updating and maintaining your Elastic Cloud deployments. So if you want to get up-and-running quickly, this is a great way to get started. And if you want to for example scale the number of nodes after the initial deployment, the Operator will take care of all of the heavy lifting for you.
Deploy Elastic Cloud operator
For our deployments, I’ll be following the steps as outlined here, but for you to follow along if you want, I’ll write down the commands I used. As mentioned the first step is to deploy the Elastic Cloud Operator, for which the Elastic site provides a simple command.
kubectl apply -f https://download.elastic.co/downloads/eck/1.3.0/all-in-one.yaml
This will install the operator in the elastic-system namespace, so we can see the operator using:
kubectl get all -n elastic-system
This should show you a single elastic-operator-0 in a running state. To check the logs of the operator use the following:
kubectl -n elastic-system logs -f statefulset.apps/elastic-operator
Deploy Elastic Search
Next we want to deploy our actual Elastic Search instance and this is now pretty straight forward.
I’ve defined the following YAML file, which will deploy a three node Elastic Search cluster and I’ve specified the volumeClaimTemplates to use the pure-file storage class. This will create a high performance NFS share on the FlashBlade system in my lab.
apiVersion: elasticsearch.k8s.elastic.co/v1
kind: Elasticsearch
metadata:
  name: quickstart
spec:
  version: 7.10.0
  nodeSets:
  - name: default
    count: 3
    config:
      node.store.allow_mmap: false
  # http:
  #   service:
  #     spec:
  #       # expose this cluster Service with a LoadBalancer
  #       type: LoadBalancer
    volumeClaimTemplates:
    - metadata:
        name: elasticsearch-data
      spec:
        accessModes:
        - ReadWriteOnce
        resources:
          requests:
            storage: 100Gi
        storageClassName: pure-file
I’ve saved the yaml above as cluster.yaml and can now deploy that on my Kubernetes cluster.
kubectl apply -f cluster.yaml
This will deploy my 3-node Elastic cluster in the current namespace. Depending on your environment, you might first want to create a new namespace and use the -n to deploy Elastic to that namespace.
To check the deployment use:
kubectl get all,pvc
Which should show you the three pods getting created, initializing and going into a running state. You should also see the three persistent volumes being created and bound.
Finally you’ll notice the three services created for this Elastic Search instance (quickstart-es-default, quickstart-es-http, quickstart-es-transport). All services are created as a ClusterIP, which is fine for me, however if you want to expose Elastic to the outside world, outside of Kubernetes you could for example change the ClusterIP to a load balancer. I’ve added the yaml to do so in the example above, but commented it out.
The final step is to get the password, that was automatically generated for the cluster, use the following to show the password (note this down).
kubectl get secret quickstart-es-elastic-user -o=jsonpath='{.data.elastic}' | base64 --decode; echoDeploy Kibana
Next we want to deploy Kibana, since it’s just a lot easier to interact with Elastic through the Kibana web interface. We use the default sample provided on the Elastic website, however in this case I did change the service type from ClusterIP to LoadBalancer, so that I can access my Kibana instance from outside of the Kubernetes cluster.
apiVersion: kibana.k8s.elastic.co/v1
kind: Kibana
metadata:
  name: quickstart
spec:
  version: 7.10.0
  count: 1
  elasticsearchRef:
    name: quickstart
  http:
    service:
      spec:
        type: LoadBalancer
Save the yaml to kibana.yaml and apply this:
kubectl apply -f kibana.yaml
That will kick-off our Kibana deployment. Check out the pods using:
kubectl get pod --selector='kibana.k8s.elastic.co/name=quickstart'
And get the IP address assigned by the load balancer using:
kubectl get service quickstart-kb-http
You should now be able to navigate to Kibana using the External IP address, pointing your browser to:
https://[IP address]:5601
This should open up the login page for Kibana.
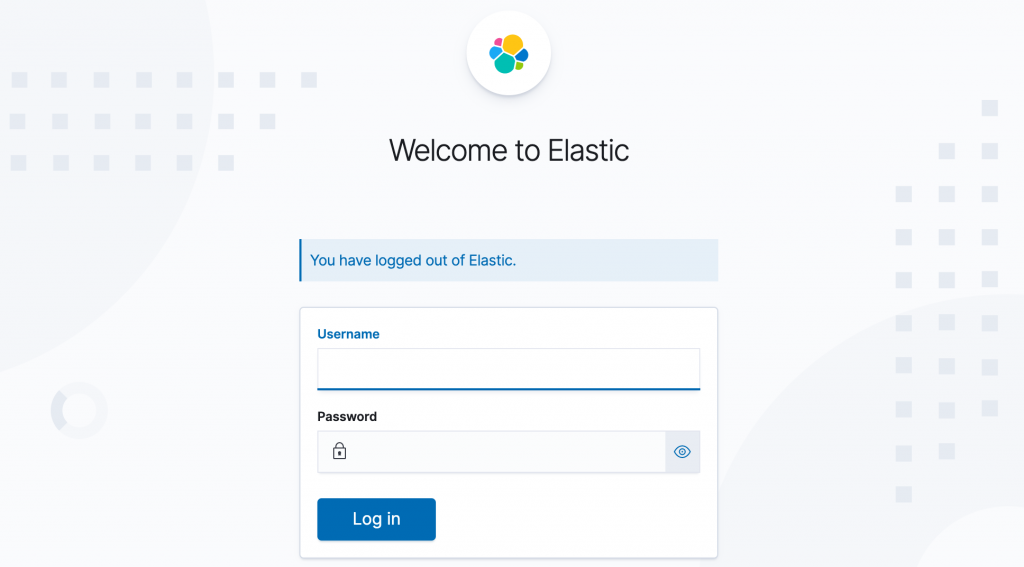
Here you can login with user elastic and the password that you noted down earlier during the Elastic deployment.
Once you’ve logged in, go ahead and explore some of the options of Elastic and Kibana. The possibilities are almost infinite.
Deploy file beat
Finally we want to ship the Kubernetes log files to Elastic Search so that we can start analysing the data in Kibana. For this we will use filebeat , which can also be deployed using Elastic Cloud.
apiVersion: beat.k8s.elastic.co/v1beta1
kind: Beat
metadata:
  name: quickstart
spec:
  type: filebeat
  version: 7.10.0
  elasticsearchRef:
    name: quickstart
  kibanaRef:
    name: quickstart
  config:
    filebeat.inputs:
    - type: container
      paths:
      - /var/log/containers/*.log
    processors:
    - add_cloud_metadata: {}
    - add_host_metadata: {}
  daemonSet:
    podTemplate:
      spec:
        dnsPolicy: ClusterFirstWithHostNet
        hostNetwork: true
        securityContext:
          runAsUser: 0
        containers:
        - name: filebeat
          volumeMounts:
          - name: varlogcontainers
            mountPath: /var/log/containers
          - name: varlogpods
            mountPath: /var/log/pods
          - name: varlibdockercontainers
            mountPath: /var/lib/docker/containers
        volumes:
        - name: varlogcontainers
          hostPath:
            path: /var/log/containers
        - name: varlogpods
          hostPath:
            path: /var/log/pods
        - name: varlibdockercontainers
          hostPath:
            path: /var/lib/docker/containers
This is a quite straight forward deployment as described in the documentation, so not a lot else to mention here. So let’s save this as filebeat.yaml and apply it.
kubectl apply -f filebeat.yaml
This should deploy filebeat and start shipping the log info into Elastic. Use the following command to check the pod status.
kubectl get pod --selector='beat.k8s.elastic.co/name=quickstart'
Conclusion
We’ve made great progress on our data pipeline journey! In the first two blogs we created and containerised our log generating application and we have now deployed a basic Elastic Search environment that is ingesting our Kubernetes logs, so we should be able to bring this all together! However that’s something for the next blog in this series, where we’ll deploy our containerised app on Kubernetes and transform the logs to a usable format for Elastic Search / Kibana. Hope you enjoyed the read, and looking forward to see you in the next one.